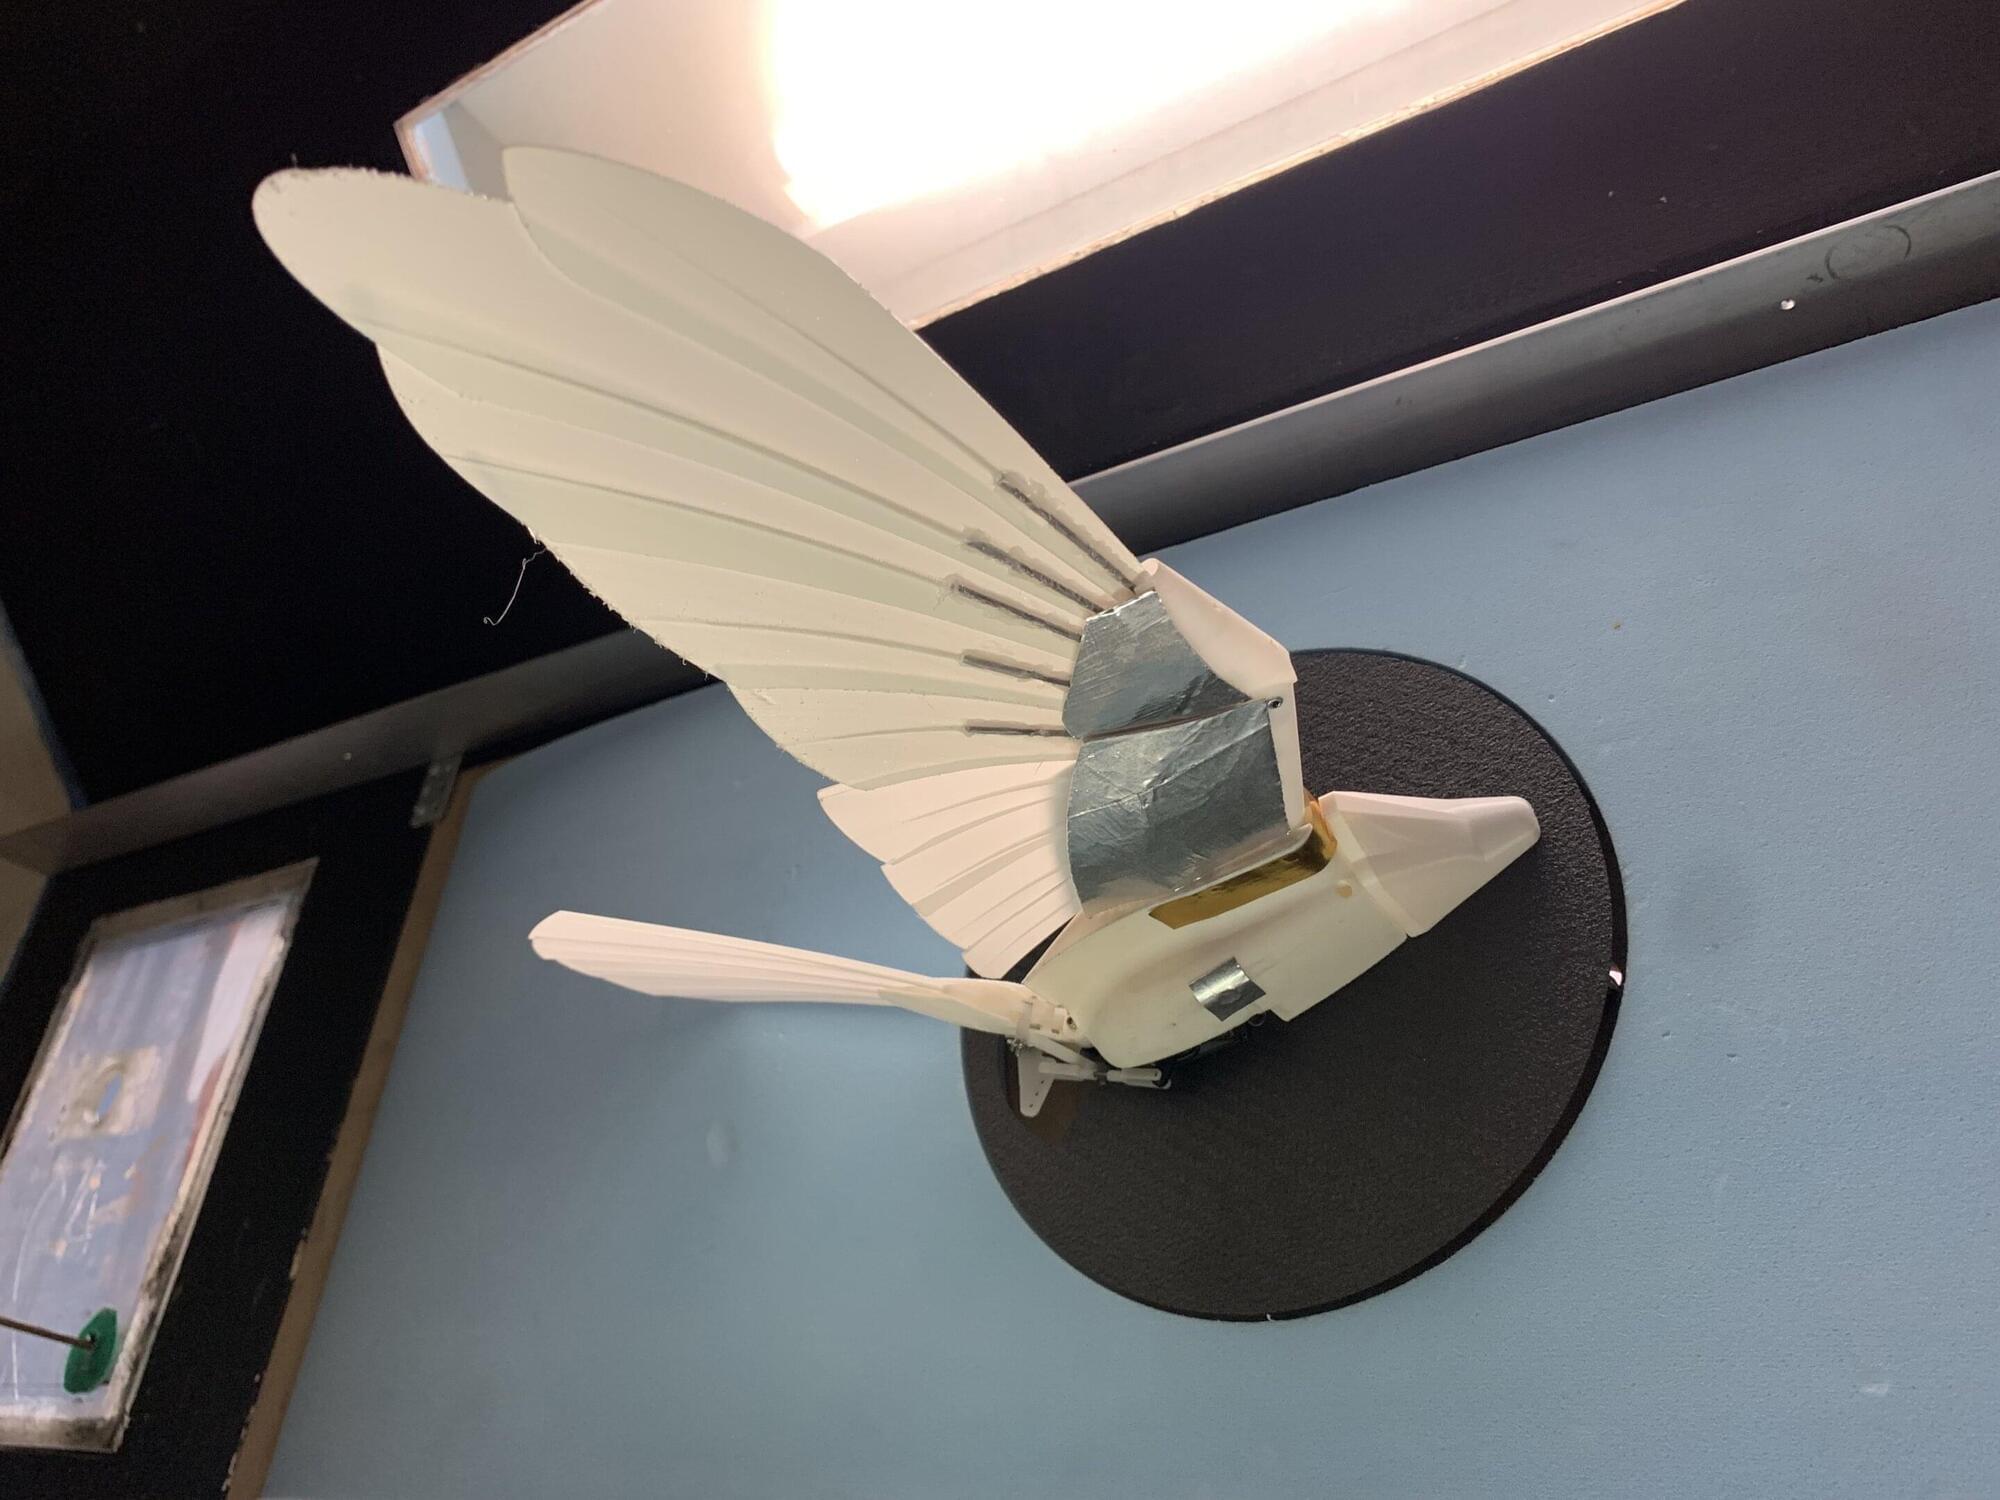
A bio-inspired robotic bird capable of mimicking the key movements of kestrels is helping researchers unravel the mysteries behind the species’ exceptional hovering capabilities.
With atmospheric turbulence expected to worsen due to climate change, understanding how birds naturally cope with rough air could help engineers design small unmanned aerial vehicles that are safer, more efficient and fly more smoothly.
Small unmanned aerial vehicles (sUAVs) are commonly used for applications including aerial photography, search and rescue, agricultural monitoring and package delivery, but are often grounded in turbulent conditions.
What if intelligence doesn’t require a brain? Biologist Michael Levin argues that intelligence is not confined to neurons, but exists on a continuum of goal-directed behavior and problem-solving across a wide range of species and systems. Using a framework he calls the “cognitive light cone,” Levin explores diverse forms of intelligence extending all the way down to the cellular level. His research suggests that cells communicate through electrical networks, enabling them to make collective decisions and adapt to unexpected challenges, evidenced by engineered tadpoles capable of seeing through eyes located on their tails. Levin radically challenges the conventional wisdom even further, proposing that forms of intelligence may extend beyond biology to molecular systems and maybe even the weather.
00:00 What is intelligence? 01:03 The field of diverse intelligence. 01:33 Intelligence at the cellular level. 02:08 The cognitive light cone. 03:01 The intelligence of groups of cells. 03:52 The bioelectric language of cells. 04:20 The mind of the body. 04:23 Cells that solve problems. 05:17 The tadpole experiment. 06:25 The cognitive spectrum. 06:48 Can you train a hurricane? 07:03 A new science of intelligence. 07:28 Beyond human biases.
——– Quanta Magazine is an editorially independent publication supported by the Simons Foundation. We focus on developments in mathematics, theoretical physics, theoretical computer science and the basic life sciences.
Are aliens watching us? The Zoo Hypothesis suggests advanced civilizations may be hiding, enforcing a galactic quarantine, or masking reality itself. Explore the Fermi Paradox, Dyson dilemma, and the unsettling possibility we are not alone—but observed.
🛒 SFIA Merchandise: https://isaac-arthur-shop.fourthwall… 🌐 Visit our Website: http://www.isaacarthur.net. ❤️ Support us on Patreon: / isaacarthur. ⭐ Support us on Subscribestar: https://www.subscribestar.com/isaac-a… 👥 Facebook Group: / 1,583,992,725,237,264 📣 Reddit Community: / isaacarthur. 🐦 Follow on Twitter / X: / isaac_a_arthur. 💬 SFIA Discord Server: / discord. Credits: The Zoo Hypothesis and the Fermi Paradox: Are We Being Watched? Written, Produced & Narrated by: Isaac Arthur. Music Courtesy of Chris Zabriskie & Stellardrone. Select imagery/video supplied by Getty Images.
Chapters. 0:00 Intro — Silence as Deliberate Choice. 2:15 The Zoo Hypothesis and Time Asymmetry. 4:30 The Dyson Dilemma (Reframed) 5:54 Heavy Stealth and the Expansion of the Zoo. 8:33 Who Are the Zookeepers? 12:23 Why Build a Zoo? 16:37 Enforcement: How the Zoo Is Maintained. 20:39 Heavy Stealth: Hiding by Overwhelming Force. 24:54 Cracks in the Glass: Can the Zoo Be Detected? 29:12 Gods & Monsters. 30:08 Leakage: Accidents, Dissidents, and the Cost of Perfection. 33:22 Graduation or Exposure: How the Zoo Ends. 37:27 What It Means If We’re Being Watched — Or Never Were. 39:15 The Bars Are Made of Time.
Heatwaves across Europe and South Asia have dominated the news recently. But these events are really a surface expression of more fundamental changes affecting our planet: Earth itself is accumulating heat faster than ever before.
We lead a large international team of scientists who come together every year to provide an update on the state of the climate system. This year, we find that Earth’s energy imbalance—the difference between the amount of energy entering and leaving the planet—has doubled in recent decades and is now at record levels.
This extra heat is a key indicator of the pace and scale of human-caused climate change. In a climate unaffected by human greenhouse gas emissions, Earth’s energy imbalance would be zero. But since the 1970s, Earth has become increasingly out of balance. This rate of increase is faster than expected, and work is underway to understand exactly why this is happening.
Climate change as the macro engine for viral emergence The BA.3.2 “Cicada” variant’s hidden evolution Yeast-display technology and viral forecasting Pan-coronavirus vaccine development at La Jolla Institute How conserved viral regions unlock universal defenses.
Scientists can now force a virus to evolve in a test tube — and predict a pandemic before it starts. Heliox explores the 2026 yeast-display breakthrough that reproduced Omicron’s exact mutations in just two generations, connects it to the climate-driven migration of bat populations worldwide, and asks: are we approaching the day when we vaccinate against a pandemic that hasn’t happened yet?
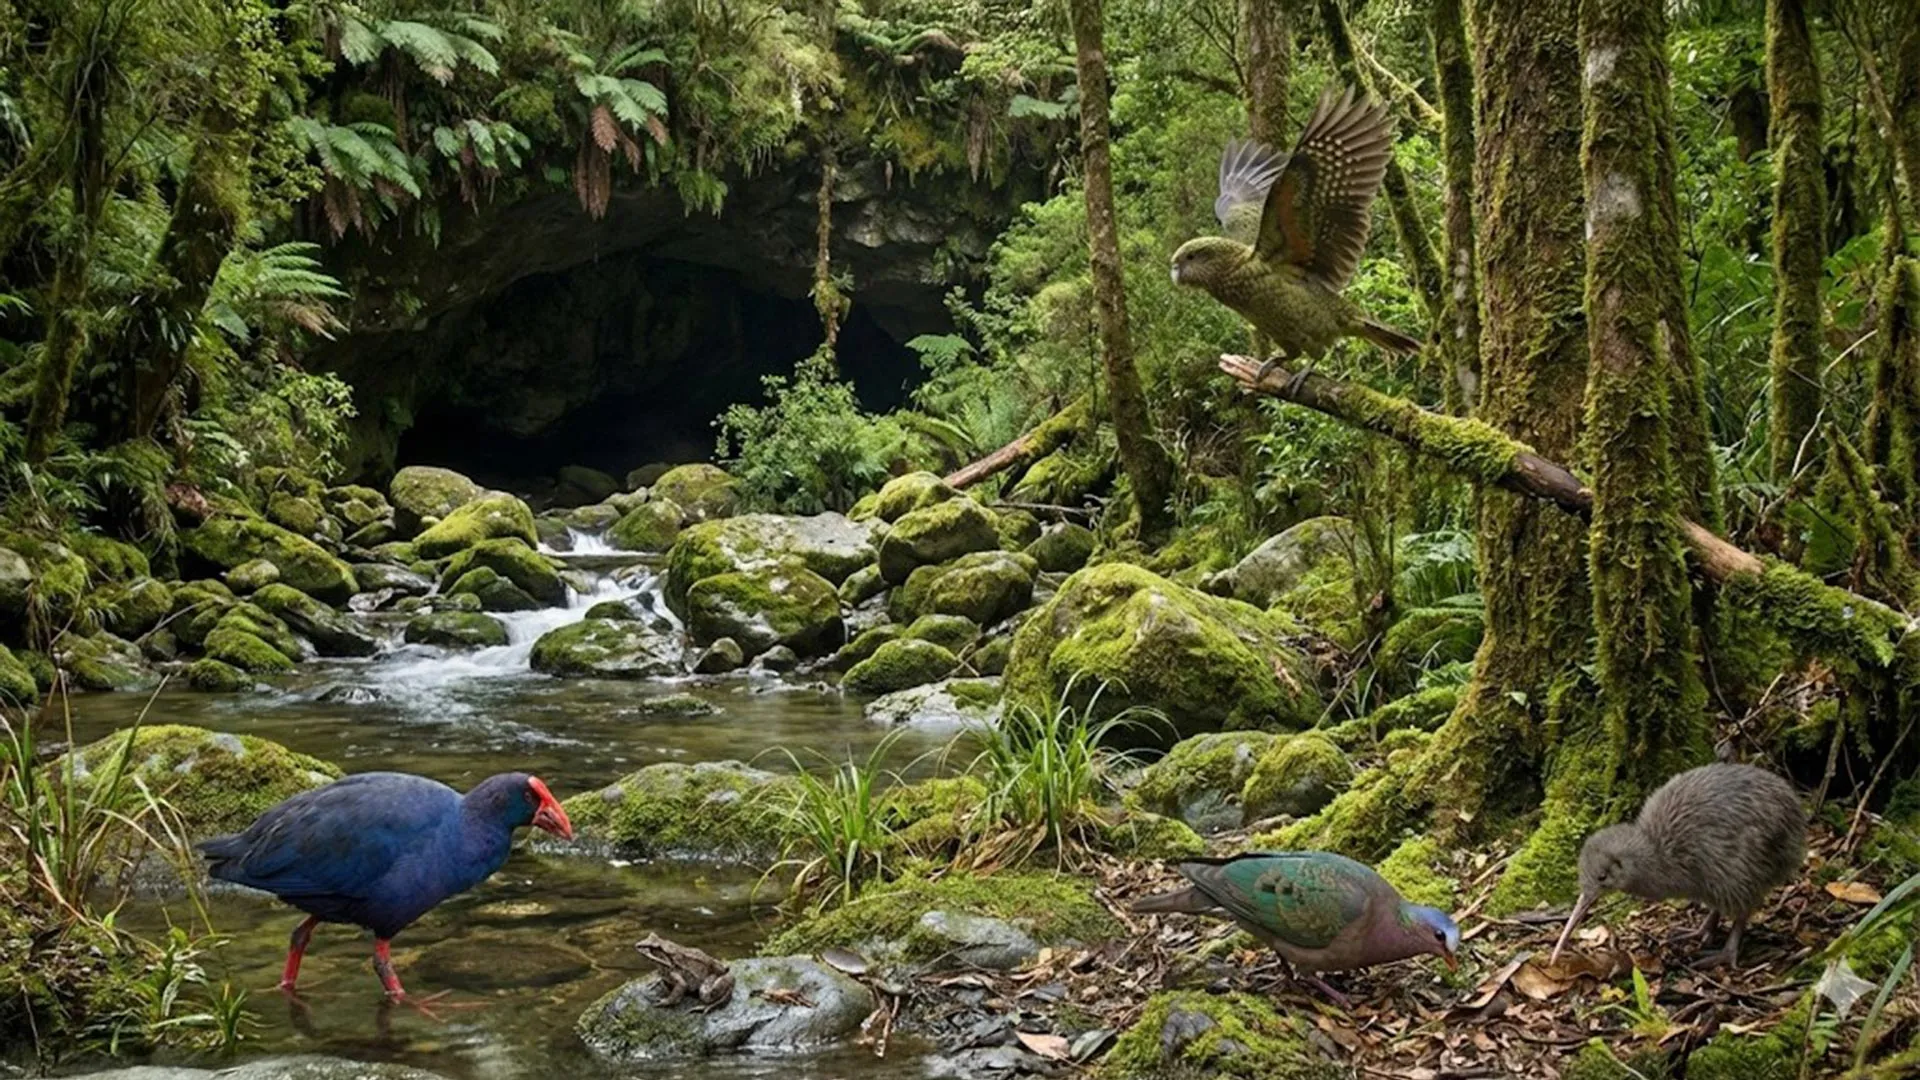
A cave in New Zealand has yielded fossils from a lost ecosystem that existed about 1 million years ago, including a possible flying ancestor of the kākāpō. The discovery reveals that volcanoes and climate upheaval were reshaping the country’s wildlife and driving extinctions long before humans arrived.
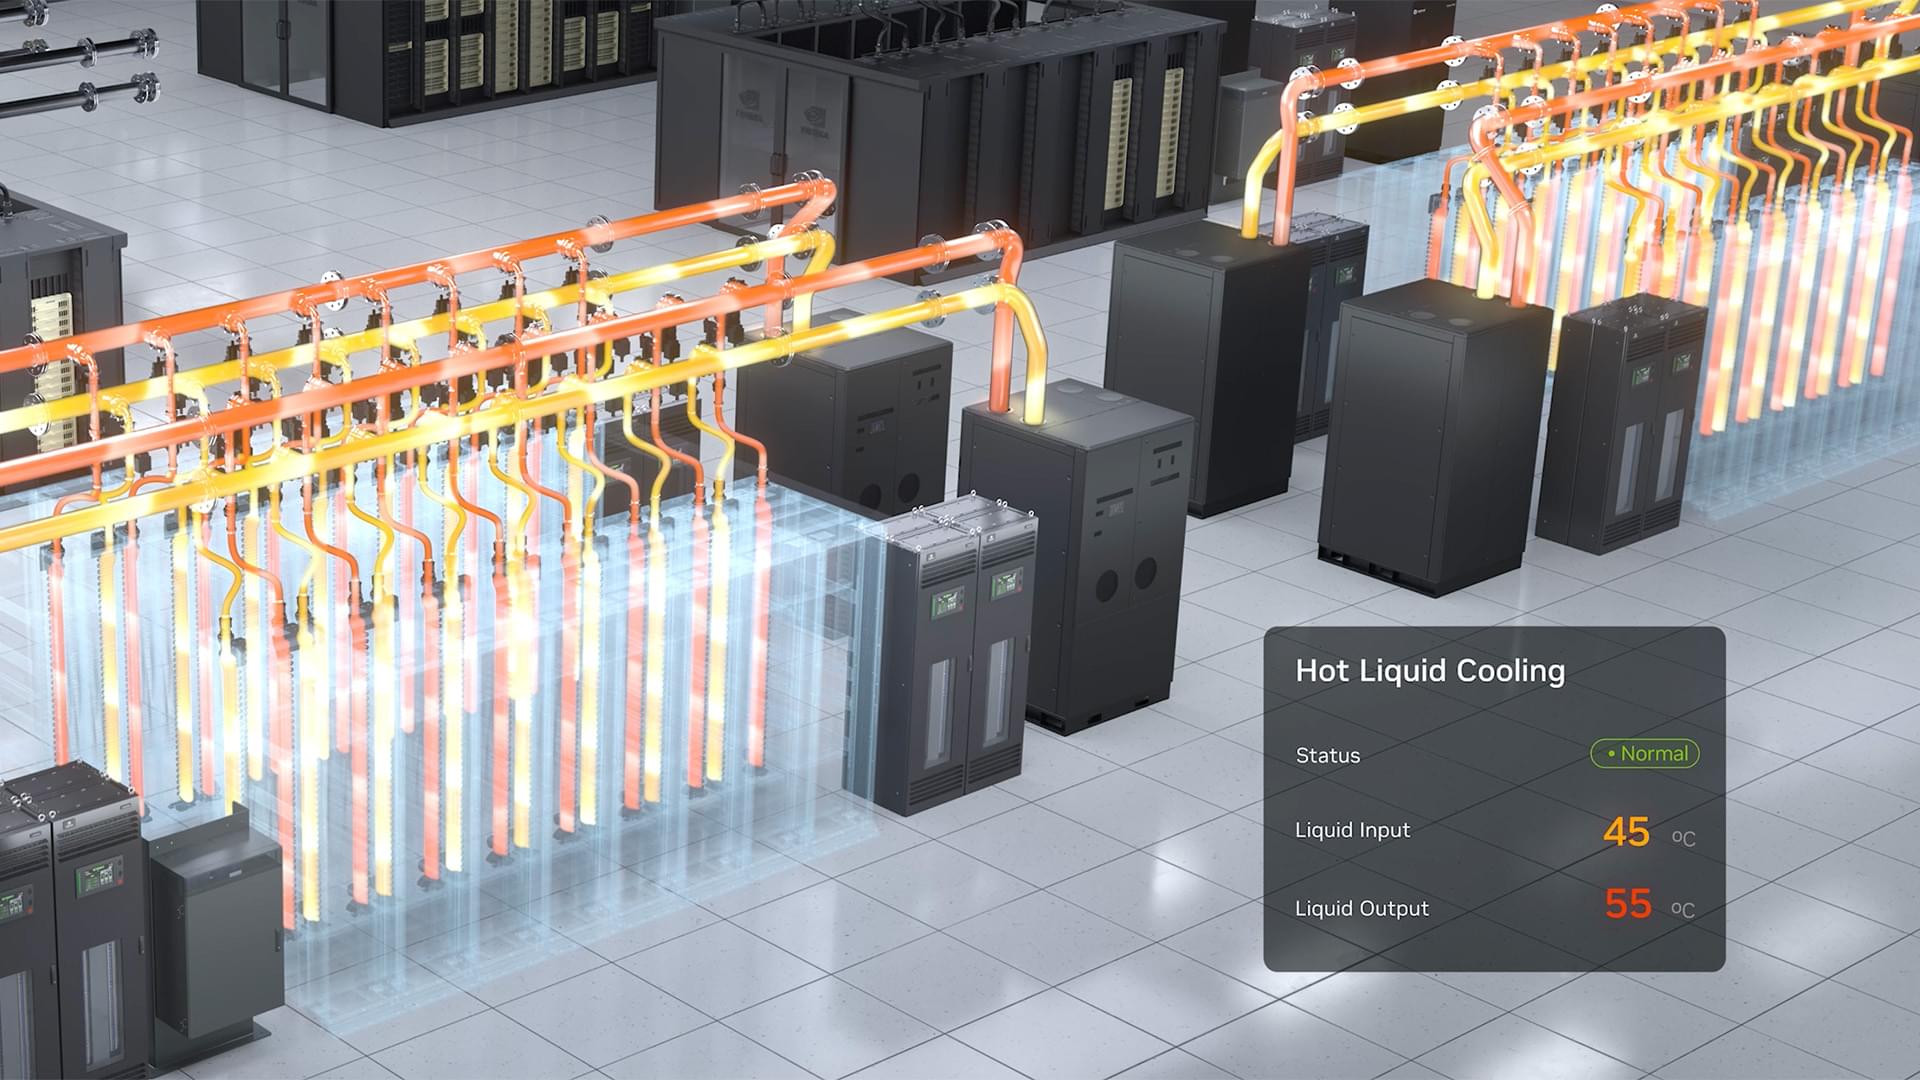
In favorable climates, NVIDIA’s 45-degree liquid-cooling architecture can enable chiller-less operation with dry coolers, reducing facility cooling water consumption from roughly 2.6 million gallons per megawatt per year for conventional cooling-tower-based systems to near zero — up to a 100% reduction in water use.
The reason: traditional air-cooled data centers depend on large volumes of cooled air to remove heat from IT equipment, often requiring energy-intensive cooling infrastructure during hot weather. With NVIDIA’s 45-degree liquid cooling, heat is captured directly at the chip and transported through liquid loops operating at much higher temperatures, allowing outdoor dry coolers to reject heat efficiently for much of the year while significantly reducing mechanical cooling requirements and facility water consumption.
The data center ambient temperature is flexible — warm summer air is fine — because nothing in the server depends on cool air. The liquid does all the work — and the same liquid can be recirculated in a closed loop so no new water is consumed to cool the chips.
NVIDIA’s latest AI servers can run on coolant warmer than a hot tub — and that counterintuitive choice is one of the biggest efficiency leaps in data center history.
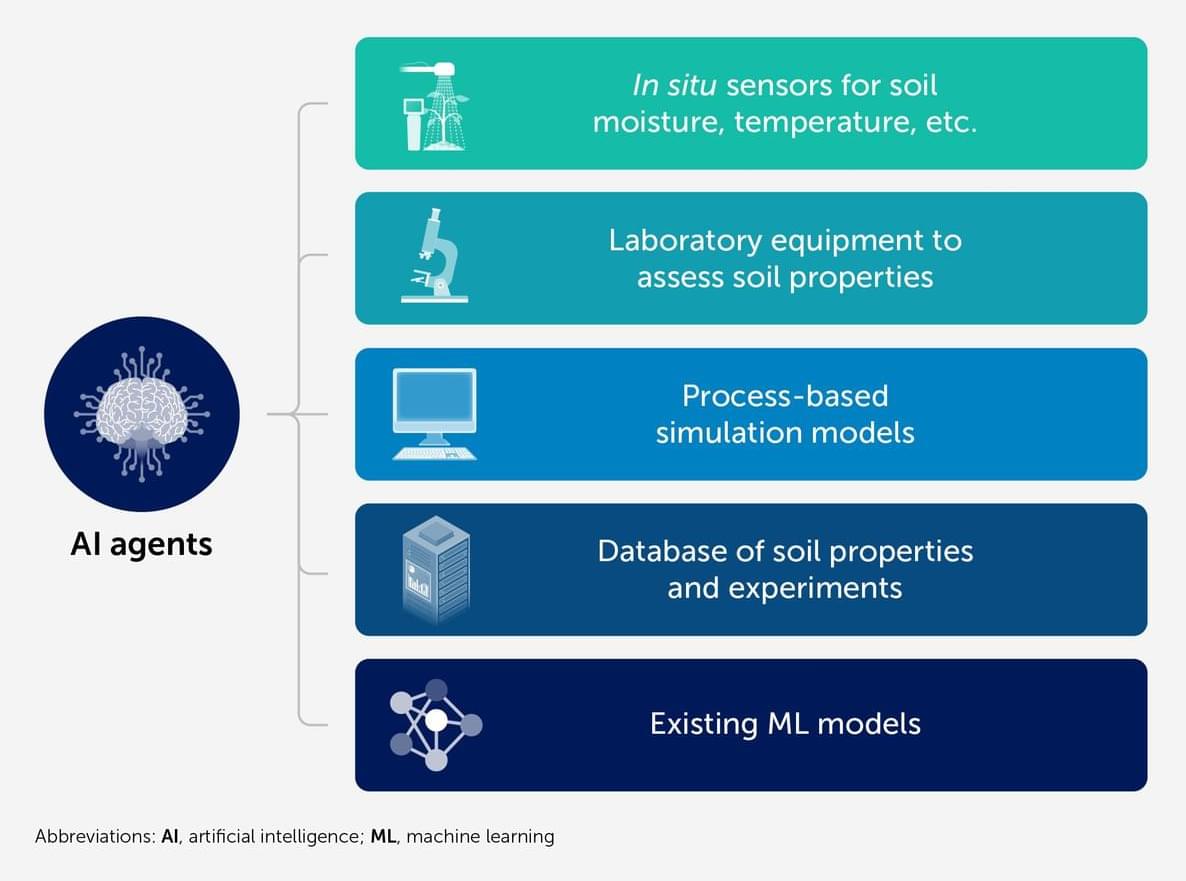
Soil science is entering a new era characterized by the integration of artificial intelligence (AI) multi-agent systems, extending the field beyond traditional machine learning (ML) applications such as digital soil mapping and spectroscopy. While current ML tools are effective for specific tasks, they often lack the reasoning, contextual integration, and adaptability required to address complex, dynamic soil systems. We propose multi-agent AI systems—autonomous, interactive software agents capable of perceptual processing, planning, and scientific reasoning—as a novel framework to support and accelerate soil science research. These agents can fulfill diverse roles, including synthesizing data from field sensors and remote sensing to create dynamic digital soil twins, generating hypotheses, designing experiments, and simulating climate-driven changes in soil function.
Nanotechnology would make possible an all purpose utility belt.
This is a near-future where climate collapse is no longer theoretical, technology moves faster than ethics, and the most dangerous question is no longer can we save the planet?—but who gets to decide how?
WhiteGrass is a CliFi technothriller grounded in real science, real power structures, and deeply human consequences. It is a story about invention and control, about families forced into impossible choices, and about artificial intelligence that may be more morally awake than its creators.
Explore the characters, the science, and the ethical fault lines shaping a future that feels uncomfortably close.